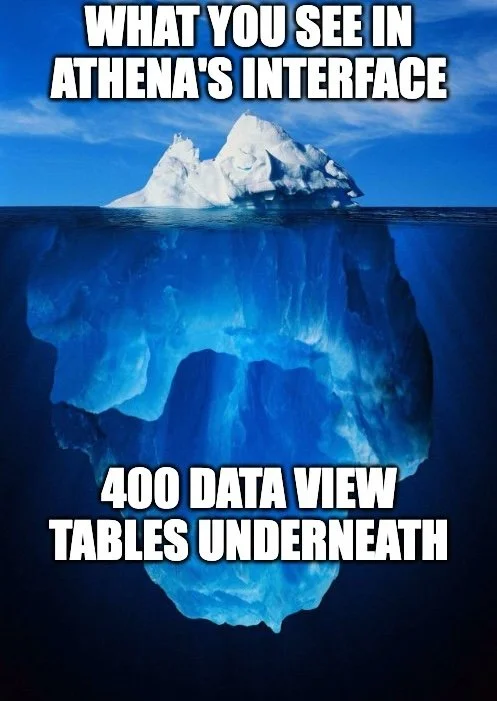
The 400 Tables Hiding Beneath Your athena Interface
Data View is athenahealth's hidden advanced mode, powerful but frustratingly hard to access.
Athena has many excellent pre-built reports that help you manage your business. Many of those reports are presented as interactive worklists that empower your teams to provide great care and get paid for that care. Others allow you to compare your practice against others on the athena network, which can provide meaningful context.
If you want to build your own report, Report Builder is at your disposal. However, it is slow to load, limited in what it can report on, and utilizes logic that only makes sense if you have technical knowledge of how the backend of athena is configured.
Enter Data View
Data View was created by athena in response to customers who wanted easier access to more of their data. Instead of needing to do a custom data warehouse feed for each client that wanted this level of access, athena created the Data View product.
Data View gives you access to around 400 tables of pre-scrubbed and formatted data, updated every evening, that make up the backend of athena. This means the data is already cleaned and structured for analysis, unlocking your ability to find process gems that increase revenue, remove bottlenecks, and improve operations.
Real-World Applications
Data View can track prior authorizations across your entire patient panel, alerting you before they expire or run out of approved visits. Standard athena reports show you expired auths after the fact. Data View helps you prevent denials before they happen.
Another powerful use case: analyzing provider scheduling patterns to predict capacity needs. By combining appointment types, no-show rates, and seasonal trends, practices can optimize templates months in advance rather than reacting week-to-week.
For practices in value-based care or alternative payment models, Data View becomes essential. These contracts require metrics that athena's standard reports simply weren't designed to track.
Visualization and Tools
While Snowflake is the default interface for Data View queries, you can really put your data to work by connecting it to visualization tools like Metabase, Looker, or Quicksite. Raw data becomes actionable when you can see trends at a glance, whether that's authorization expiration timelines on a dashboard or provider productivity heat maps. These HIPAA-compliant BI tools transform rows of data into insights you can act on immediately.
The Challenge
The biggest challenge with Data View isn't knowing what you want to measure, most practices have a clear wish list of reports they need. The challenge is the technical execution: decoding ~400 backend tables where names don't match athena's user interface, figuring out complex table relationships, and knowing which fields contain reliable data. Without deep system knowledge, even simple-sounding reports become frustrating technical puzzles.
Turn on Advanced Mode
You know what reports you need. I know how to build them.
After spending over a decade at athena, visiting 100+ practices and working across product development, implementation, and operations, I've mastered the technical complexities that make Data View intimidating.
Through my consulting firm, I build the custom Data View reports you've been wanting but couldn't create yourself. Whether you're underutilizing your current Data View subscription or haven't signed up because the technical barrier seemed too high, I turn your reporting requirements into working SQL queries and dashboards.
You bring the vision, I handle the technical execution. Let's discuss how I can help you finally build those Data View reports you need.
I'm Max Alsgaard-Miller, Managing Director of Alsgaard-Miller LLC. I help health tech companies and innovative practices unlock the full potential of their athena data.

